はじめに
この記事は IDaaS Advent Calendar 2022 24日目の投稿です。
こんにちは、TC3 Data science部門の@mumeco_mlです!普段はAI分野での研究開発を担当しているのでAuth0等のCIAMに関しては初心者なのですが、CIAMのログデータをPythonで読み込み何が出来るのかという観点で調査ををしてみました。今回使用するコードはColabで公開しているので皆様のデータで簡単に再現できると思います。BigQueryなんかに投げてしまえばすぐ終わることかもしれませんが、このスクリプトを使えば作業時間かからずサクッと無料で出来ます!
ログデータの取得
データ分析をするにはまずデータを集める必要があります。今回はこの記事の方法に従いAuth0のログデータがS3等のバケットに保存されていると想定しています。そして今回はColab環境上で読み込みたいので、そのデータをGoogle Driveへアップロードしてください。
本調査では弊社の開発環境で得られた少量のログデータを使っていきます。
ログ分析
では実際にログの分析を始めていきます。まず、Colab上でログデータを読み込みます。以下のコードの中のtarget_drive_pathは各自でauth0のログのパスを指定してください。
import json
import datetime
import matplotlib.pyplot as plt
import pandas as pd
import numpy as np
import pytz

from glob import glob
from tqdm import tqdm
from collections import defaultdict
from sklearn.decomposition import PCA
from sklearn.cluster import KMeans
from sklearn.preprocessing import normalize

target_drive_path = "drive/MyDrive/colab_data/auth0_advent/*"
log_names = glob(f"{target_drive_path}/**/auth0*", recursive=True)
raw_logs = []
decoder = json.JSONDecoder()
for i in tqdm(range(len(log_names))):
  with open(log_names[i], 'r') as f:
    line = f.readline()
    while line:
      raw_logs.append(decoder.raw_decode(line))
      line = f.readline()
logs = [x[0] for x in raw_logs]
これで読み込みが出来ました。この状態で進めてもいいのですが、logsリストは時系列的な順序が整っていないので一応整列しておきます。
def datetime_reader(dt):
  dt = datetime.datetime.strptime(dt, '%Y-%m-%dT%H:%M:%SZ')
  return dt

logs = list(sorted(logs, key=lambda x: datetime_reader(x['time'])))整列した後なのでlogs[0]は一番最初のデータとなっているはずですね。サンプルとしてこれを見てみます。ちなみに以下の内容は実際の値を記事用に書き換えているので、数字の桁数などは実際のものとは異なっています。
{'version': '0',
 'id': 'test',
 'detail-type': 'Auth0 log',
 'source': 'hoge.com/auth0.logs',
 'account': '111',
 'time': '2022-12-02T04:09:45Z',
 'region': 'ap-northeast-1',
 'resources': [],
 'detail': {'log_id': '11111',
  'data': {'date': '2022-12-02T04:09:33.879Z',
   'type': 'seccft',
   'description': '',
   'connection_id': '',
   'client_id': 'test',
   'client_name': 'test',
   'ip': '0.0.0.0',
   'user_agent': 'Go-http-client/2.0',
   'hostname': 'test.com',
   'user_id': '',
   'user_name': '',
   'audience': 'https://test/',
   'scope': 'read:client_grants create:client_grants delete:client_grants update:client_grants read:users update:users delete:users create:users read:users_app_metadata update:users_app_metadata delete:users_app_metadata create:users_app_metadata read:user_custom_blocks create:user_custom_blocks delete:user_custom_blocks create:user_tickets read:clients update:clients delete:clients create:clients read:client_keys update:client_keys delete:client_keys create:client_keys read:connections update:connections delete:connections create:connections read:resource_servers update:resource_servers delete:resource_servers create:resource_servers read:device_credentials update:device_credentials delete:device_credentials create:device_credentials read:rules update:rules delete:rules create:rules read:rules_configs update:rules_configs delete:rules_configs read:hooks update:hooks delete:hooks create:hooks read:actions update:actions delete:actions create:actions read:email_provider update:email_provider delete:email_provider create:email_provider blacklist:tokens read:stats read:insights read:tenant_settings update:tenant_settings read:logs read:logs_users read:shields create:shields update:shields delete:shields read:anomaly_blocks delete:anomaly_blocks update:triggers read:triggers read:grants delete:grants read:guardian_factors update:guardian_factors read:guardian_enrollments delete:guardian_enrollments create:guardian_enrollment_tickets read:user_idp_tokens create:passwords_checking_job delete:passwords_checking_job read:custom_domains delete:custom_domains create:custom_domains update:custom_domains read:email_templates create:email_templates update:email_templates read:mfa_policies update:mfa_policies read:roles create:roles delete:roles update:roles read:prompts update:prompts read:branding update:branding delete:branding read:log_streams create:log_streams delete:log_streams update:log_streams create:signing_keys read:signing_keys update:signing_keys read:limits update:limits create:role_members read:role_members delete:role_members read:entitlements read:attack_protection update:attack_protection read:organizations_summary create:actions_log_sessions read:organizations update:organizations create:organizations delete:organizations create:organization_members read:organization_members delete:organization_members create:organization_connections read:organization_connections update:organization_connections delete:organization_connections create:organization_member_roles read:organization_member_roles delete:organization_member_roles create:organization_invitations read:organization_invitations delete:organization_invitations',
'log_id': '1111'}}}このサンプルを見てみると、ログデータのjsonのうちdetail内に細かいイベントデータ内容が含まれているようです。ひとまず最初はそれ以外のデータをちょっと見てみます。一番手っ取り早い方法はユニーク数を数えることです。
key_all = defaultdict(lambda: [])
for log in logs:
  for key in log.keys():
    if not isinstance(log[key], (list,dict)):
      key_all[key].append(log[key])
key_unique = {x[0]:set(x[1]) for x in key_all.items()}
for key,val in key_unique.items():
  print(key, len(val))
すると以下のように、ユニークidや時間以外は全て同じ(ユニーク数が1)値を示していることが分かりました。
version 1
id 133
detail-type 1
source 1
account 1
time 133
region 1つまり、detail以外のデータは基本的にはユーザではなくAuth0のアカウント情報を表しているため、ユーザに関するログ分析をしたい場合は使う必要はないでしょう。一応、時間情報が得られていますのでこれを可視化してみると以下のようになります。
df = pd.DataFrame(key_unique['time'], columns=['datetime'])
df['datetime'] = pd.to_datetime(df['datetime'])
df.hist(bins=60)
plt.title('Number of generated logs')
plt.xticks(rotation=45)
plt.show()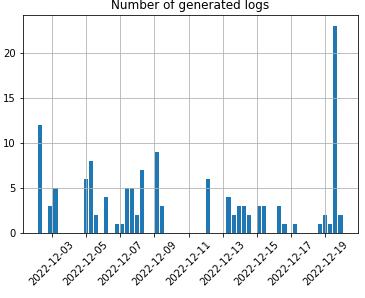
次にこのデータを時間ごとに表示させてみます。これでどの時間帯に多くアクセスされているかが分かります。
df['event_num'] = [1 for _ in range(len(df))]
log_hour = df.groupby([df['datetime'].dt.hour]).event_num.sum()
log_hour_count = []
for i in log_hour.items():
  log_hour_count.extend([i[0] for _ in range(i[1])])
plt.title('Number of genereted logs each hour')
plt.hist(log_hour_count, bins=24,rwidth=0.8, label=[i for i in range(24)])
plt.show()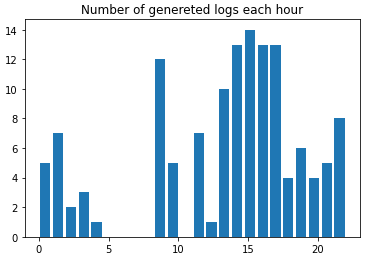
これを見るとお昼の時間帯に多くアクセスされていることが分かります。一方で朝の時間帯はあまりアクセスされていないようです。
では次に、detail情報の分析をしていきましょう。先ほどと同じようにまずはユニーク数を数えてみます
logs_detail = [x['detail']['data'] for x in logs]
# check detail content
key_all = defaultdict(lambda: [])
for log in logs_detail:
  for key in log.keys():
    if not isinstance(log[key], (list,dict)):
      key_all[key].append(log[key])
    # else:
    #   print(f'detect unhashble data: {key}{log[key]}')
key_unique = {x[0]:set(x[1]) for x in key_all.items()}
for key,val in key_unique.items():
  print(key, len(val))
date 133
type 13
description 8
connection_id 3
client_id 2
client_name 3
ip 43
user_agent 14
hostname 1
user_id 11
user_name 14
audience 1
scope 1
log_id 133
connection 2
strategy 2
strategy_type 2
session_connection 1
tracking_id 1大体どの要素がユニークに何を表しているののかが分かってきましたね。ユニーク数が大量にあるものを見ても仕方ないので、ある程度少ない要素の値を見ていきます。今回はこのユニーク数が15以下のデータを表示させてみます。
for key,val in key_unique.items():
  if len(val)<15:
print(key, val)この結果はかなり個人情報等を含んでいたので記事での公開は止めておきます。特にuser_nameカラムにはユーザのemailアドレスが含まれていました。実際の分析ではuserに紐づけて何かしら分析をしていくと思うので、せっかくなので今回はこのユーザ履歴を使ってクラスタリングをしてみたいと思います。(今回のようなごく少量のデータでは有用な結果とはならないと思いますが…)
まずはユーザ毎にAuth0のログをまとめてみます。例のごとくログの多い順に表示してみましょう。
users = defaultdict(lambda: 0)
for log in logs_detail:
  for key,val in log.items():
    if key == 'user_name':
      users[val]+=1
users = list(sorted(users.items(), key=lambda x: x[1], reverse=True))
for u in users:
  print(u[0],u[1])
User_0 41
User_1 33
User_2 26
User_3 10
User_4 4
User_5 3
User_6 3
User_7 2
User_8 1
User_9 1
User_10 1
User_11 1
User_12 1
User_13 1メールアドレスはUser_{i}でマスクさせています。これを見ると4,5ユーザが全ログデータのうち多くを占めていますね。ここから各ユーザーのログイン時間から特徴量を作ってみたいと思います。まず、各ユーザーのログイン時間のリストを作成します。
users_login_time = defaultdict(lambda: [])
jst = pytz.timezone('Japan')
for log in logs_detail:
  if 'user_name' in log.keys():
    users_login_time[log['user_name']].append(datetime.datetime.strptime(log['date'], '%Y-%m-%dT%H:%M:%S.%fZ').replace(tzinfo=jst).hour)
次に、各ユーザーのログイン時間を特徴量化する関数を定義します。
def create_feature(hours):
  sin_list = np.array([np.sin(h/24) for h in hours])
  cos_list = np.array([np.cos(h/24) for h in hours])
  features = np.array([np.mean(sin_list), np.std(sin_list), np.mean(cos_list), np.std(cos_list)])
  return features

user_features = np.stack([create_feature(h) for _, h in users_login_time.items()])
user_features
array([[4.41958716e-01, 1.91014277e-01, 8.71765296e-01, 9.06162647e-02],
[3.34603554e-01, 2.03203159e-01, 9.17065523e-01, 7.57612387e-02],
[2.16441618e-01, 1.30858641e-01, 9.66720795e-01, 3.84700848e-02],
[2.06829560e-01, 0.00000000e+00, 9.78376989e-01, 0.00000000e+00],
[3.00597784e-01, 3.76137144e-02, 9.52942105e-01, 1.12927194e-02],
[5.37861856e-01, 8.55534279e-02, 8.37267932e-01, 4.86584442e-02],
[2.88357992e-01, 1.89323726e-01, 9.35742969e-01, 7.34254075e-02],
[0.00000000e+00, 0.00000000e+00, 1.00000000e+00, 0.00000000e+00],
[3.66272529e-01, 0.00000000e+00, 9.30507622e-01, 0.00000000e+00],
[3.66272529e-01, 0.00000000e+00, 9.30507622e-01, 0.00000000e+00],
[4.64521360e-01, 2.17117400e-01, 8.50300645e-01, 1.18611776e-01],
[2.06829560e-01, 0.00000000e+00, 9.78376989e-01, 1.11022302e-16],
[2.06829560e-01, 0.00000000e+00, 9.78376989e-01, 0.00000000e+00],
[0.00000000e+00, 0.00000000e+00, 1.00000000e+00, 0.00000000e+00]])ここでやっていることはとても単純で、各ユーザーのログイン時間をsin関数、cos関数でそれぞれ変換した後に、それぞれの平均と標準偏差を計算しています。つまり、[sin関数:平均、sin関数:標準偏差、cos関数:平均、cos関数:標準偏差]の4次元の特徴量が各ユーザーに作られることになります。なぜわざわざ三角関数を通すかというと、時間という情報は周期性を持つからです。例えば、数値上は0時と23時はとても離れていますが、実際は深夜という意味で近い値であるべきです。これはsin関数、cos関数へ通すことで解決します。詳しくはこの記事などを参考にしてください。
次になぜ平均と標準偏差を計算するかというと、平均はそのユーザーの平均的なログイン時間を表すのに対し、標準偏差はそのユーザーのログイン時間がどれぐらいばらついているかを表すため、違った情報量を持つことが出来るためです。
これで ユーザ x 特徴量(4次元) のmatrixが出来たので可視化をしていきます。特徴量次元が4で、このままでは可視化が出来ないので主成分分析を用いて次元数を2へ圧縮します。
pca = PCA(n_components=2)
user_features_norm = normalize(user_features)
user_features_pca = pca.fit_transform(user_features_norm)
user_features_pca
array([[-0.21023361, -0.05176371],
[-0.10514511, -0.10096378],
[ 0.04434323, -0.07546165],
[ 0.10893359, 0.04439746],
[ 0.00452124, 0.04718554],
[-0.25935173, 0.09097135],
[-0.05410367, -0.10736005],
[ 0.29573743, -0.04055283],
[-0.04403471, 0.10974002],
[-0.04403471, 0.10974002],
[-0.25023656, -0.07417443],
[ 0.10893359, 0.04439746],
[ 0.10893359, 0.04439746],
[ 0.29573743, -0.04055283]])これで ユーザ x 特徴量(2次元) が出来たので、2軸のグラフへプロットすることが出来ます。
plt.scatter(user_features_pca[:,0], user_features_pca[:,1])
for i in range(len(user_features_pca)):
  plt.text(user_features_pca[i,0], user_features_pca[i,1], f'{i}')
plt.show()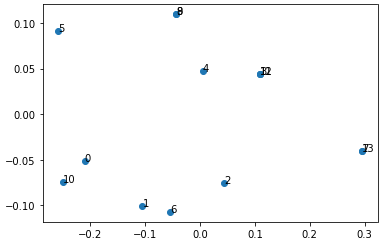
ログの数が少なく全く同じ特徴量のユーザがいるためにラベルが重なってしまい、ちょっとおかしい部分があるのですが、無事可視化することが出来ました。次に、これらのユーザのクラスタリングをシンプルな手法であるKmeansで実施してみます。事前にクラスタ数を設定する必要がありますが、少量データなので2にしています。
kmeans = KMeans(n_clusters=2, random_state=0)
kmeans_result = kmeans.fit_predict(user_features)
kmeans_result
array([0, 0, 1, 1, 0, 0, 0, 1, 0, 0, 0, 1, 1, 1], dtype=int32)各ユーザーが0と1に分かれました。後はこの情報と先ほどの主成分分析の結果を使って可視化してみます。
c = ['blue','red']
for i in range(len(user_features_pca)):
  plt.scatter(user_features_pca[i,0], user_features_pca[i,1], c=c[kmeans_result[i]])
  plt.text(user_features_pca[i,0], user_features_pca[i,1], f'{i}')
plt.show()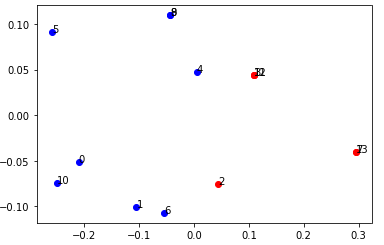
無事、2つのクラスタに分けることが出来ました。この2つのクラスタの内訳を細かく調べてみたところ、赤色のクラスタはログイン時間が狭い時間帯に密集しているクラスタであることが分かりました。つまり、ログイン時間の標準偏差がとても小さいということですね。今回はデータ量が少なかったため、あまり良い分析となりませんでしたが、このクラスタリングの使い道としては次のようなストーリーが考えられます。
- あなたの会社は自社の商品を販売するECサイトを持っています。
- あなたはECサイトの売り上げ量を増やすために施策を考えてほしいと依頼されました。
- そこで、ECサイトでの商品の売り上げデータとAuth0でのデータを比較してみたところユーザのアクティブな時間とその購買率に差があることが分かりました。
- なのでAuth0のログを用いてクラスタリングを実施し、高い購買率のクラスタに対してその商品をおすすめする内容のメールを送りました(再度購入するような商品)。
- メールを送った結果、分析の結果の通り購買率が高く、効率的に売り上げ量が増加しました。
実際には購買データの推薦アルゴリズムなんかも作れるので簡単にはできないとは思いますが、情報の1つとして持っておくと何かに使えるかもしれません。
おわりに
今回はAuth0のログデータを対象に簡単なデータ分析をしてみました。Python上でログデータを読み込み、ログデータのカラム情報の表示、ログデータの生成された時間の分析、そしてユーザーのログイン時間の特徴量化と簡単なクラスタリングまで実施しました。本格的な運用をするのであればBigQueryなどで分析をするといいと思うのですが、簡単な調査の目的であればPythonを使ってやるのがおすすめかなと感じました。もし次回があればBigQuery等を用いた分析もしてみたいです。(その時まではもっとログデータが欲しいですが…)
告知
TC3では、Gigコミュニティとの革新的なコラボレーションでOkta/Auth0などのCIAM領域やDataScience/AI分野での社会実装をより進めていくエンジニアを大募集しています!TC3の話が聞きたい、ちょっと興味がある、社内の文化や雰囲気が知りたいという方は@mumeco_mlまでご連絡頂ければご相談に乗れますし、お店でお肉でも食べながらカジュアルにご紹介も可能でございます!
TC3の会社概要はこちら
TC3の応募ポジション一覧はこちら
TC3の社員インタビューはこちら
ソリューションサービスのご紹介
TC3はOkta CIC(Customer Identity Cloud)を代表とするIDaaSを活用したデジタルサービス開発のプロフェッショナルです(Customer Identity Cloudの認定も取得しています)。
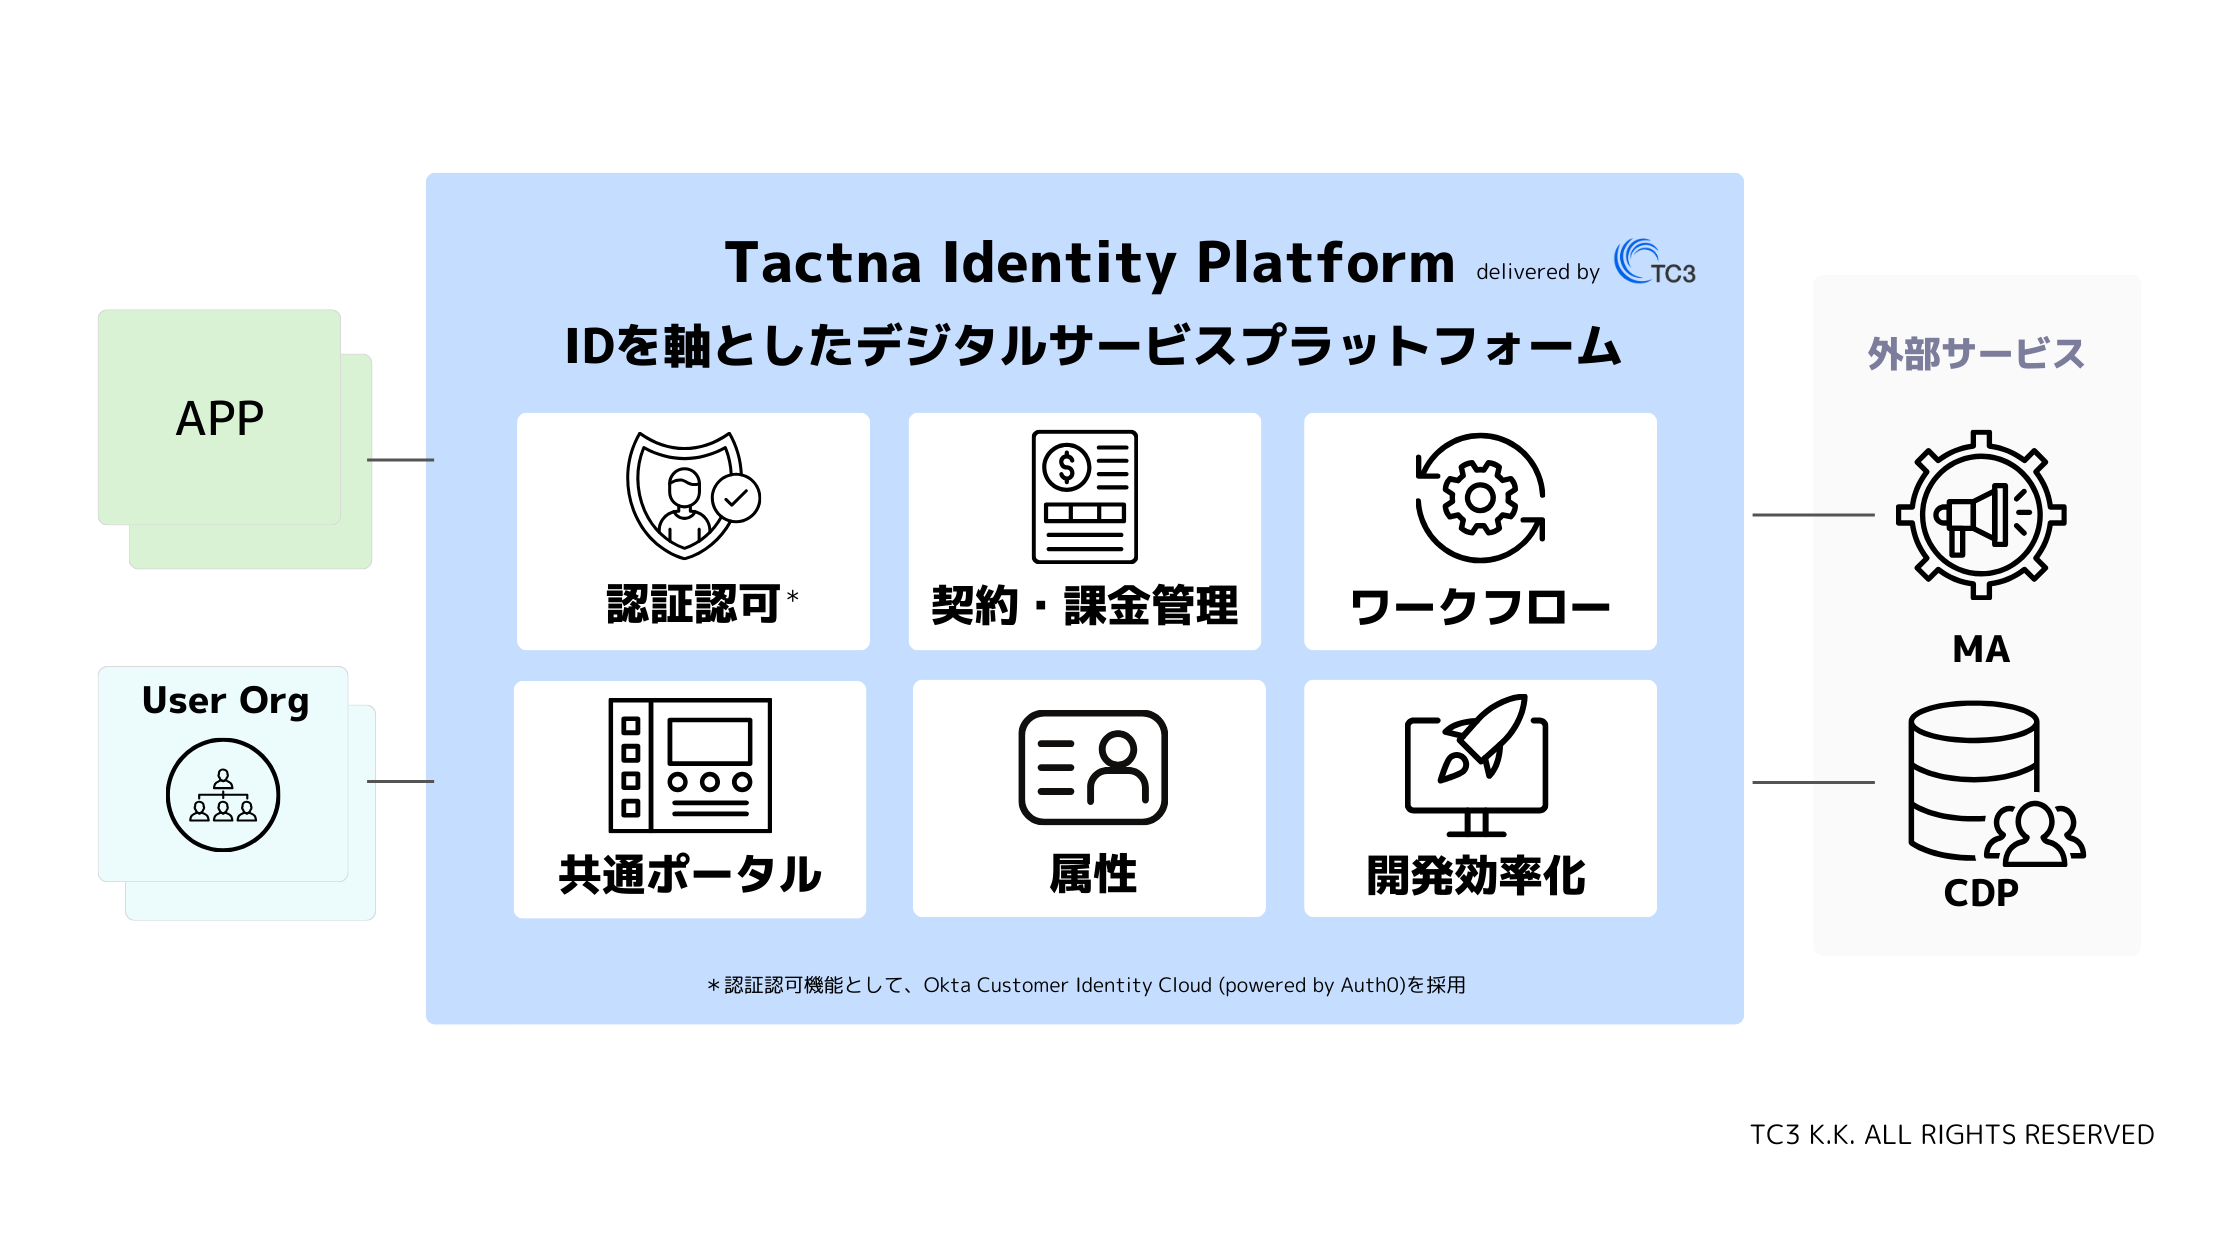
すでに実践的に設計・実装された基盤サービスとして2024年5月末に、「Tactna Identity Platform」を発表しました!このサービスを活用いただくことで、事業部やサービス間の調整を減らし、リリースまでの期間を早め、ユーザー体験を向上させるといったメリットの多い開発プランをご提供します。
トライアル・MVP開発の段階から、どのようにIDaaS/CIAMを導入するかについてもサポートさせていただきますので、お気軽にお問い合わせください。
Tactna Identity Platformに関する詳細のご紹介資料は以下からダウンロードいただけます!
ひとまず情報のキャッチアップだけしておきたいという方は、こちらからニュースレターの購読ができます。